Mapping Mangroves using SAR (Ambanja Bay, Madagascar)
Overview
Mangrove ecosystems play a critical role in protecting coastlines, sustaining biodiversity, and supporting local livelihoods. In this project, I used Sentinel-1 SAR and Sentinel-2 optical data to map mangrove extent and analyze land cover change in Ambanja Bay, Madagascar. By comparing SAR-only and fused SAR–optical classification approaches, I evaluated how data integration influences mapping accuracy in complex tropical environments. The final workflow produced a clearer understanding of mangrove distribution, highlighted areas of potential loss, and demonstrated the strengths and limitations of remote sensing methods for conservation-focused monitoring.
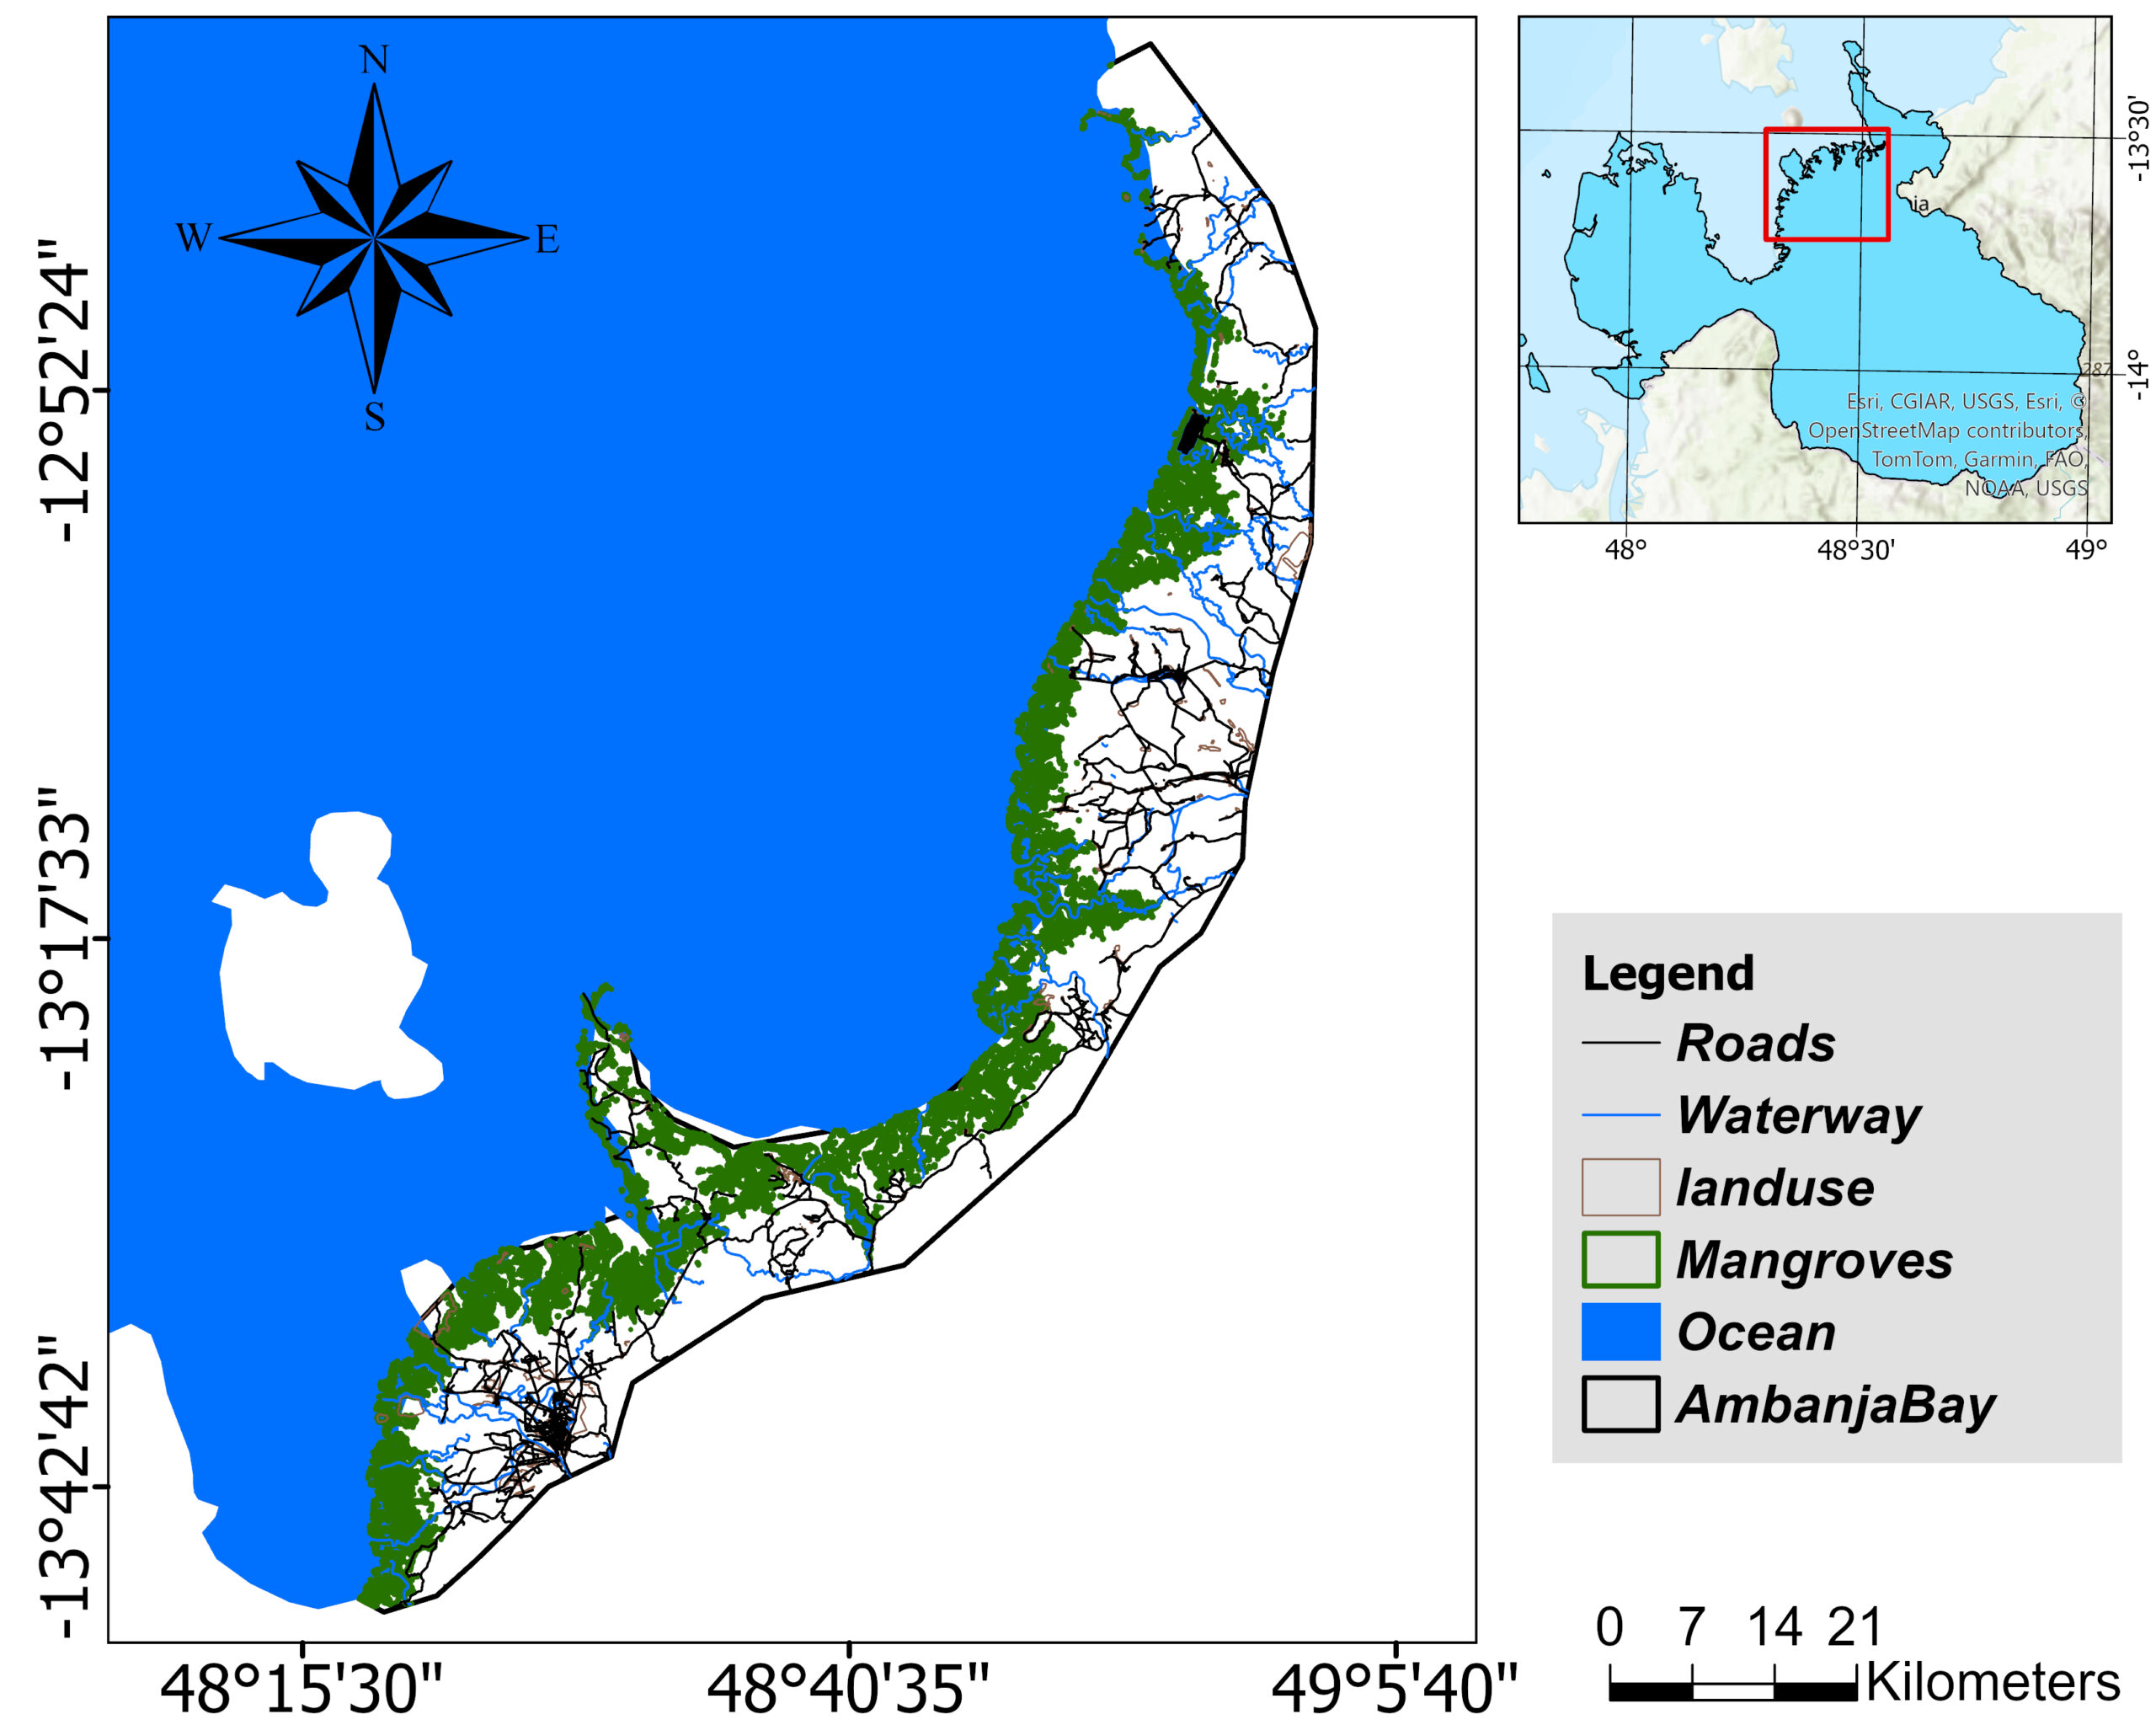
Study Area and Context
Ambanja Bay is located in northwestern Madagascar within the Diana Region, an area known for extensive mangrove forests that support fisheries, carbon storage, and local community livelihoods. These ecosystems form a natural buffer against coastal erosion and storm surges, and they provide critical habitat for both marine and terrestrial species. Despite their importance, mangroves in this region are threatened by urban expansion, agriculture, charcoal production, and aquaculture activities.
Monitoring mangrove change in Madagascar is a growing priority for conservation groups and local authorities. The country is considered a global hotspot for mangrove loss, which makes consistent and reliable mapping essential for understanding how land use patterns are affecting ecosystem health. Ambanja Bay offers a clear example of this challenge. The landscape is a mixture of dense mangroves, open water, bare mudflats, cropland, and settlement areas, and these varied classes create spectral confusion that makes remote sensing classification more difficult. This study area therefore provides a strong testing ground for comparing SAR-only classification to a data fusion approach that combines both SAR and optical information.
Objectives
This project aimed to assess how well SAR-only classification performs compared to a fused SAR and optical approach when mapping mangrove ecosystems in Ambanja Bay. The specific objectives were:
- To preprocess Sentinel-1 and Sentinel-2 datasets and derive relevant predictors for land cover mapping.
- To classify mangrove and non-mangrove land cover using a Random Forest model based on SAR data alone.
- To integrate optical indices with SAR predictors and evaluate how data fusion influences classification accuracy.
- To generate a set of maps that highlight current mangrove extent and patterns of change across the study area.
- To analyze classification performance using accuracy metrics and identify the strengths and limitations of each approach.
These objectives guided the workflow that follows, from data preparation to model evaluation and interpretation.
Data and Tools
This project combined synthetic aperture radar and optical satellite data to capture both structural and spectral characteristics of mangrove ecosystems.
Satellite Data
- Sentinel-1 SAR (C-band, IW mode, VV and VH polarization):
Used for its ability to penetrate cloud cover and capture backscatter information related to vegetation structure and moisture. - Sentinel-2 MSI (Level-2A surface reflectance):
Provided multispectral information for vegetation indices and land cover differentiation.
Derived Predictors
From the raw datasets, several additional variables were created to support classification:
- SAR features: VV, VH, VV/VH ratio, and spatial texture metrics such as entropy, contrast, mean, and variance.
- Optical indices: NDVI and RVI for vegetation health and biomass representation.
Software and Processing Environment
- Google Earth Engine: Used for data access, preprocessing, index generation, and Random Forest classification.
- QGIS: Used for visualization and final map production.
- R: Used for reviewing results and preparing summary outputs.
Together, these tools supported an end-to-endworkflow from data preparation to accuracy assessment.
Methods
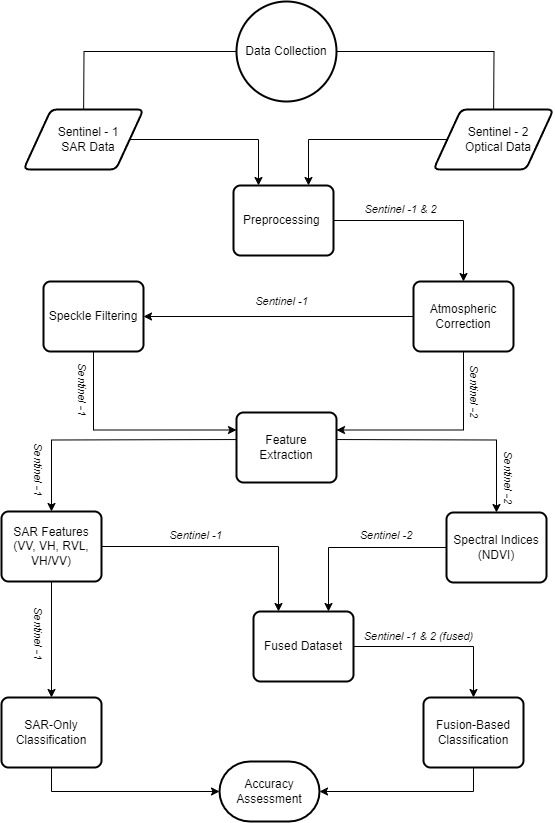
The workflow for this project followed a complete remote sensing pipeline that integrated Sentinel-1 SAR and Sentinel-2 optical data for land cover classification. Sentinel-1 GRD imagery (VV and VH) was radiometrically calibrated, terrain corrected, and speckle filtered before extracting VV, VH, and the VV/VH ratio. Sentinel-2 Level-2A imagery was cloud masked and atmospherically corrected, and two vegetation indices, NDVI and RVI, were derived to represent greenness and biomass. These processed variables were then grouped into two predictor sets: a SAR-only set consisting of VV, VH, and VV/VH, and a fused dataset that combined SAR variables with NDVI and RVI. Training samples were created for water, mangroves, non-mangroves, and barren land, and were used consistently across both models. Two Random Forest classifiers were developed to compare performance: one using only SAR predictors and one using the fused predictor set. Each classification output was assessed using a confusion matrix, and producer’s accuracy, user’s accuracy, and overall accuracy were used to evaluate how well each model captured the distribution of mangrove and non-mangrove classes across Ambanja Bay.
Results
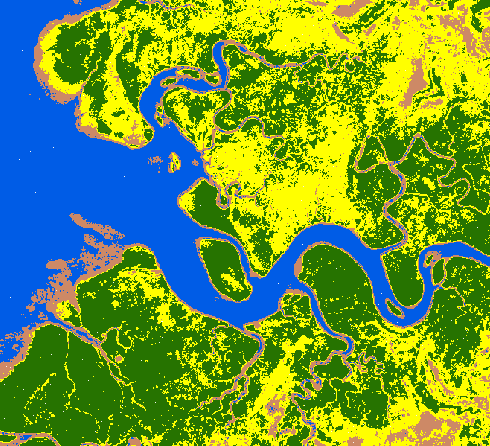
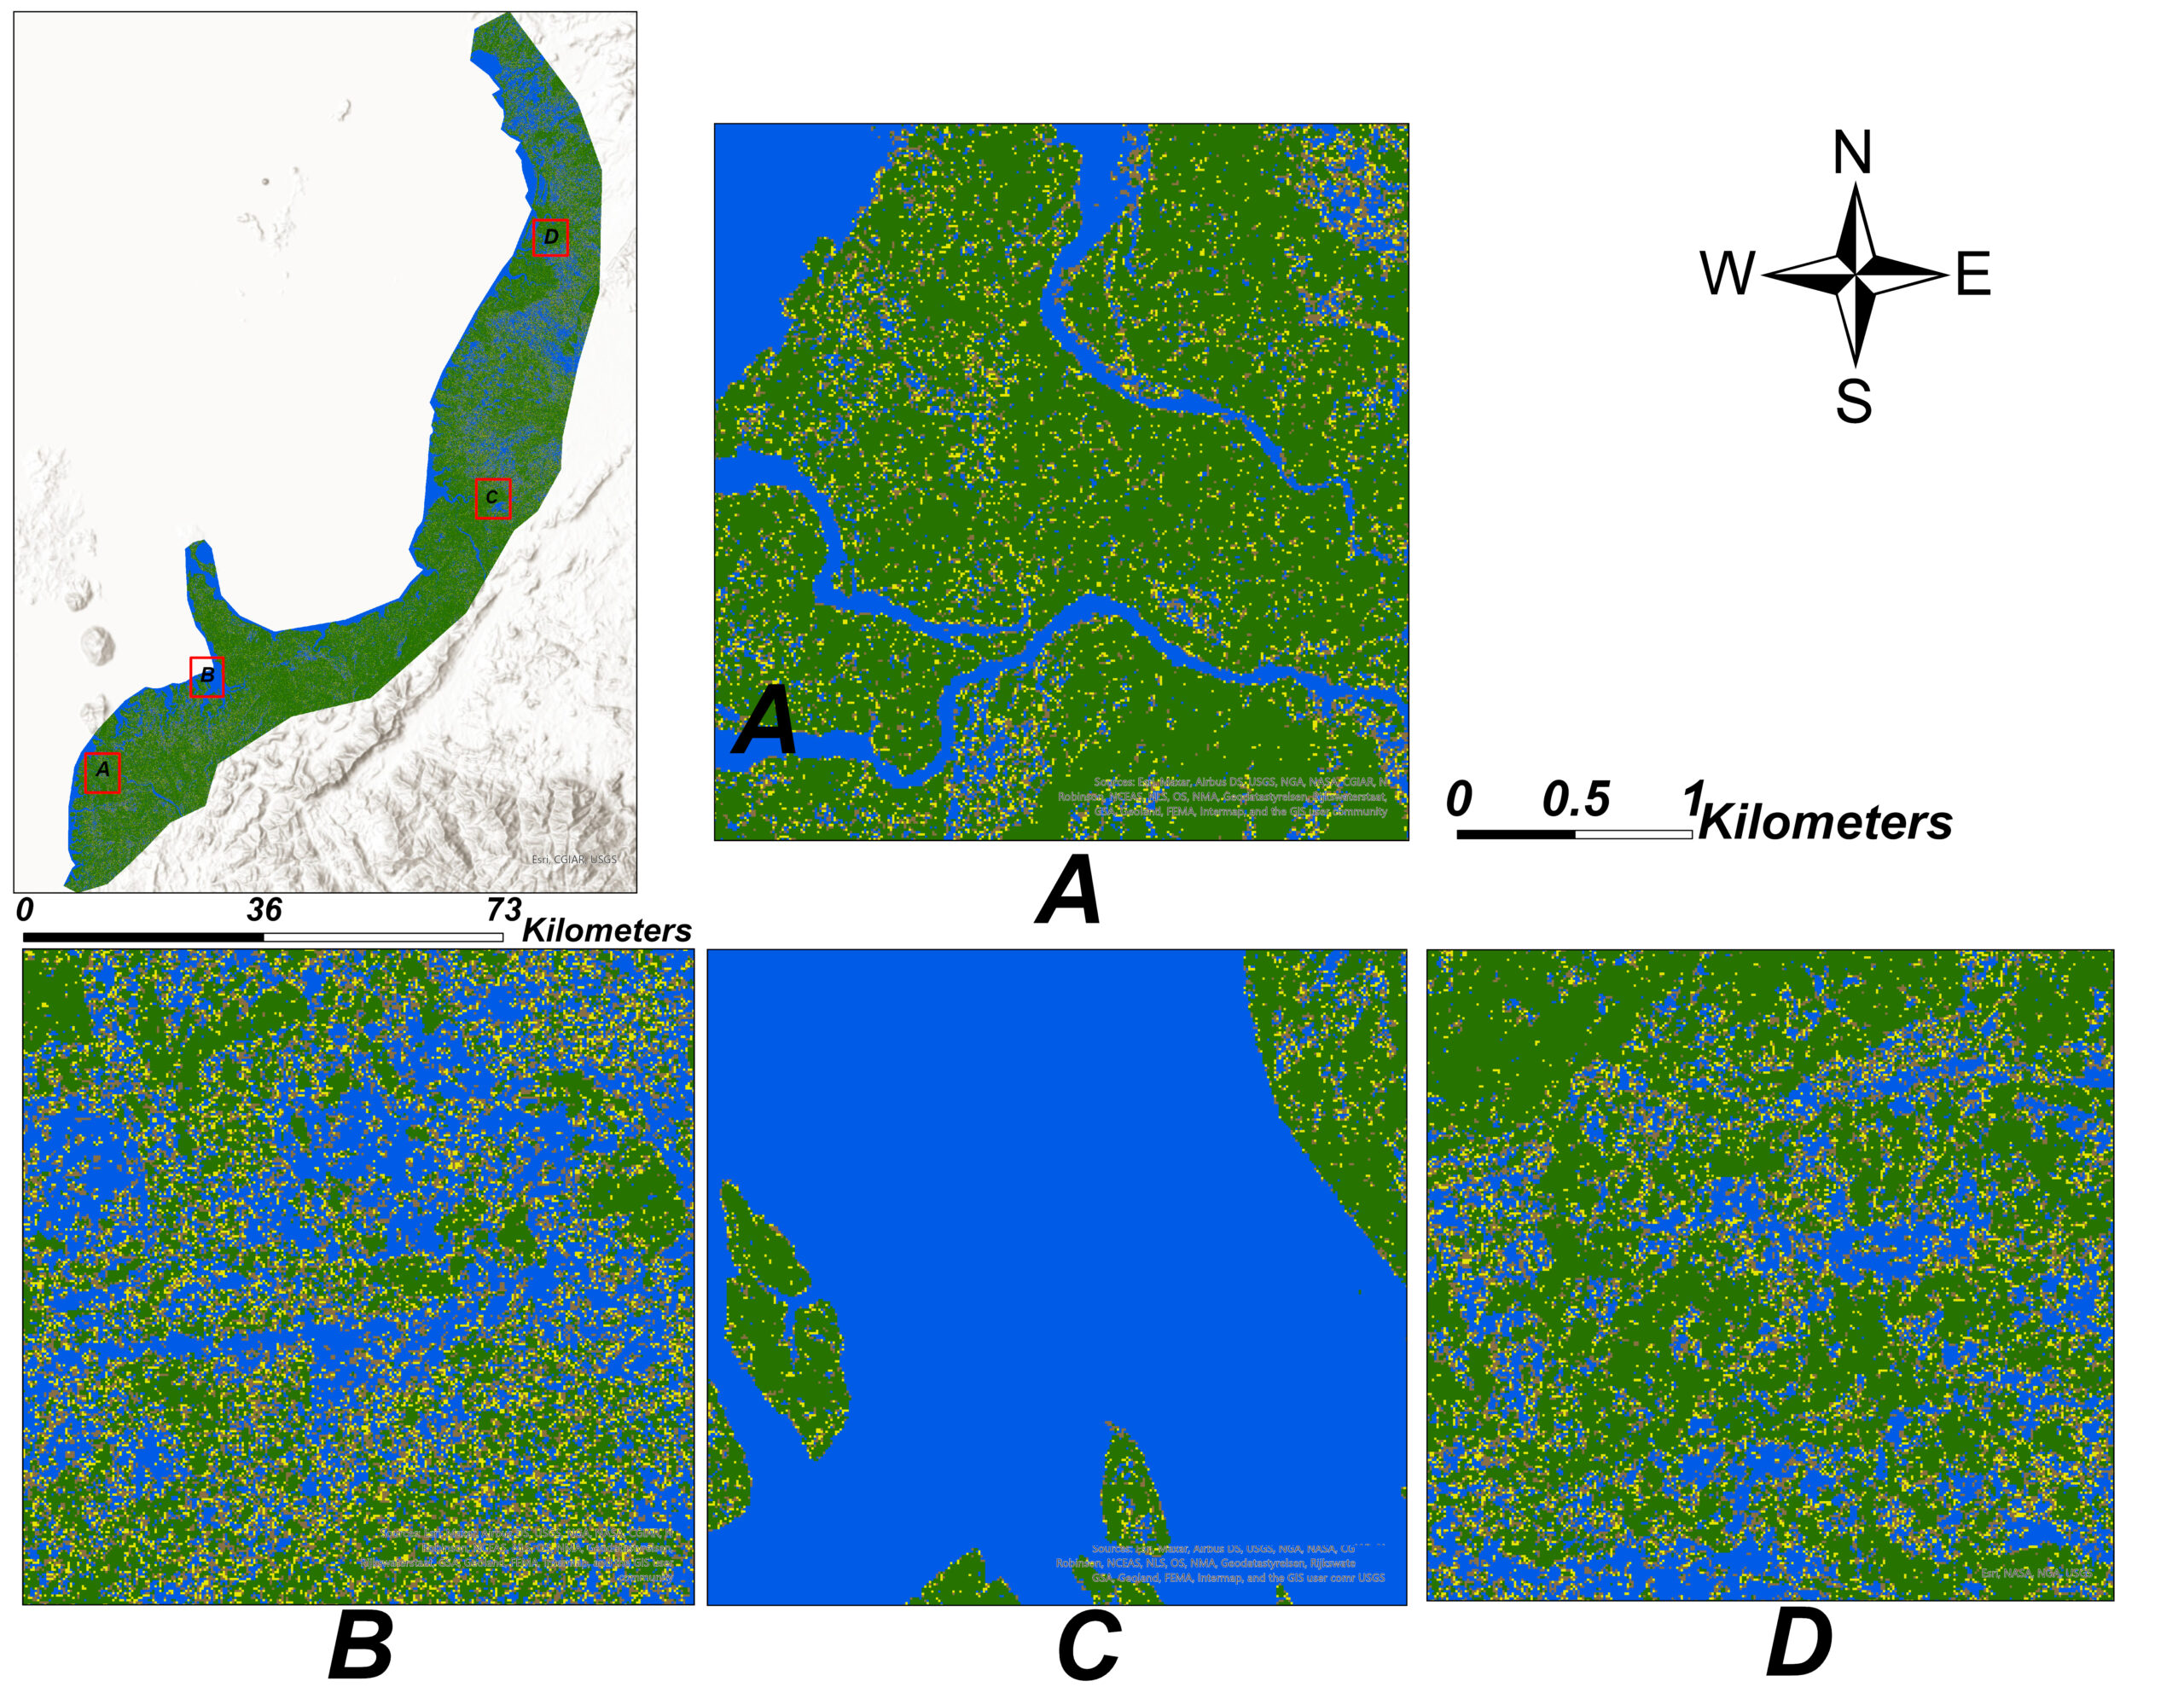
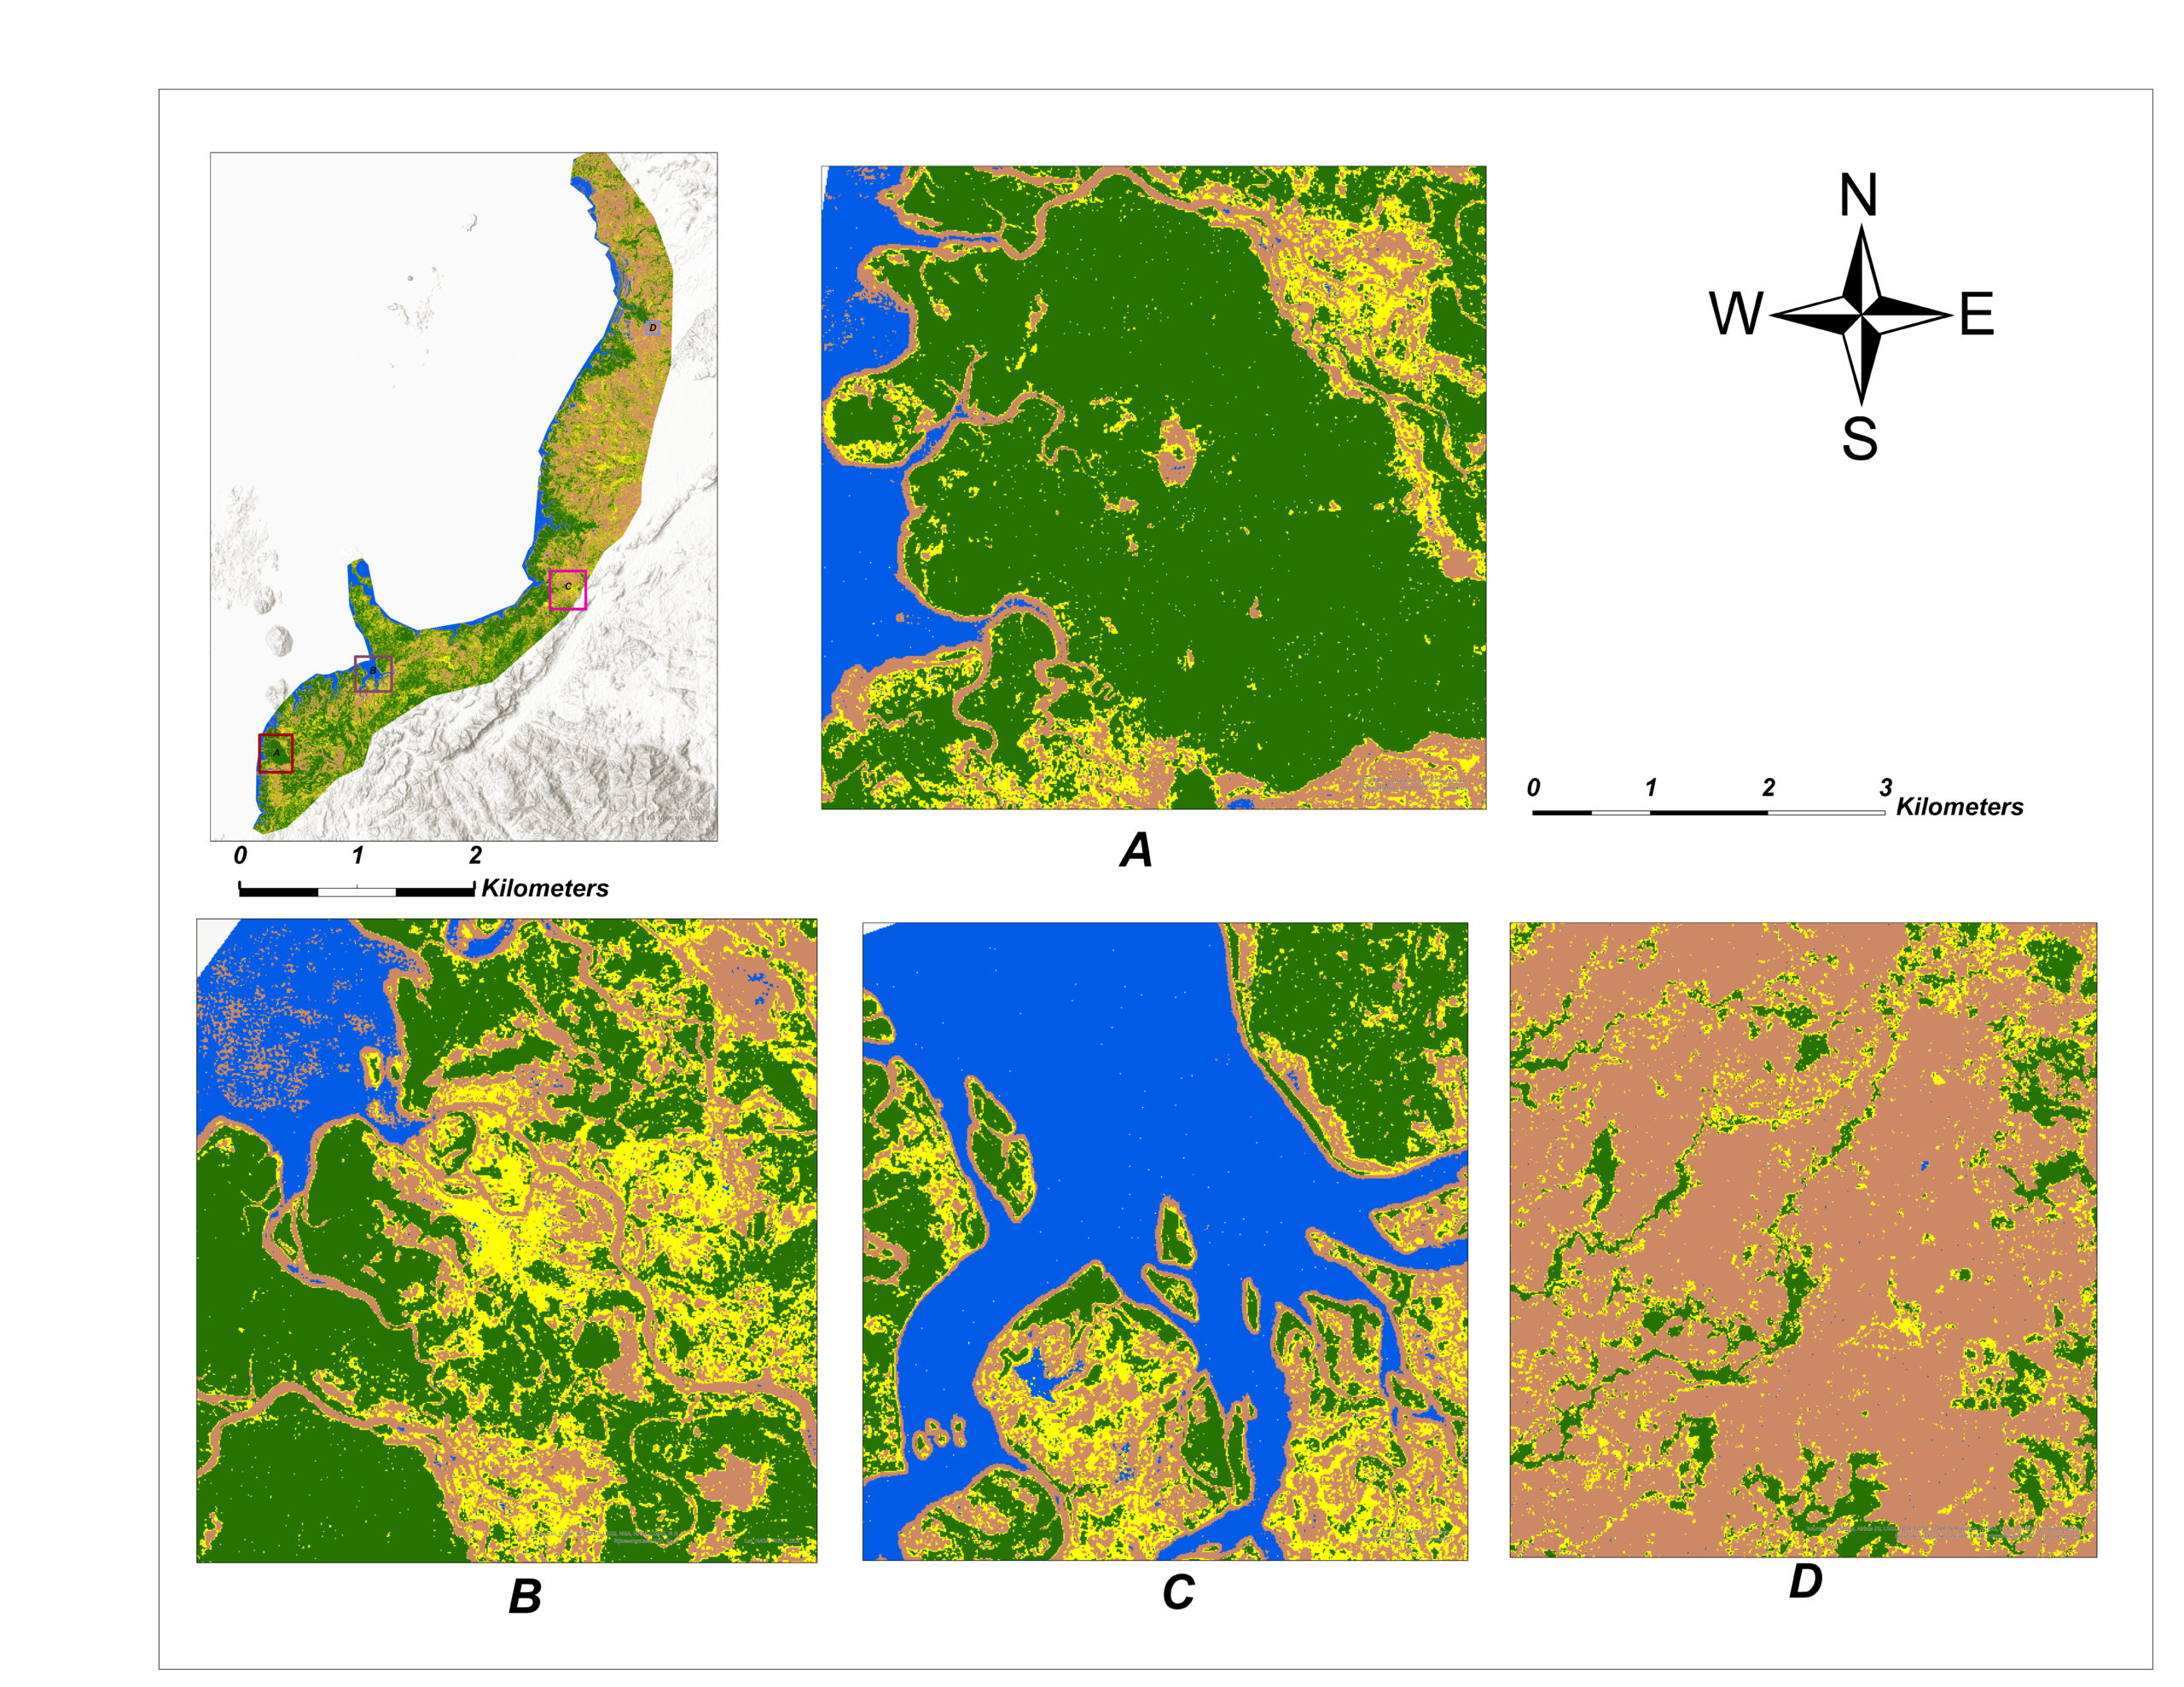
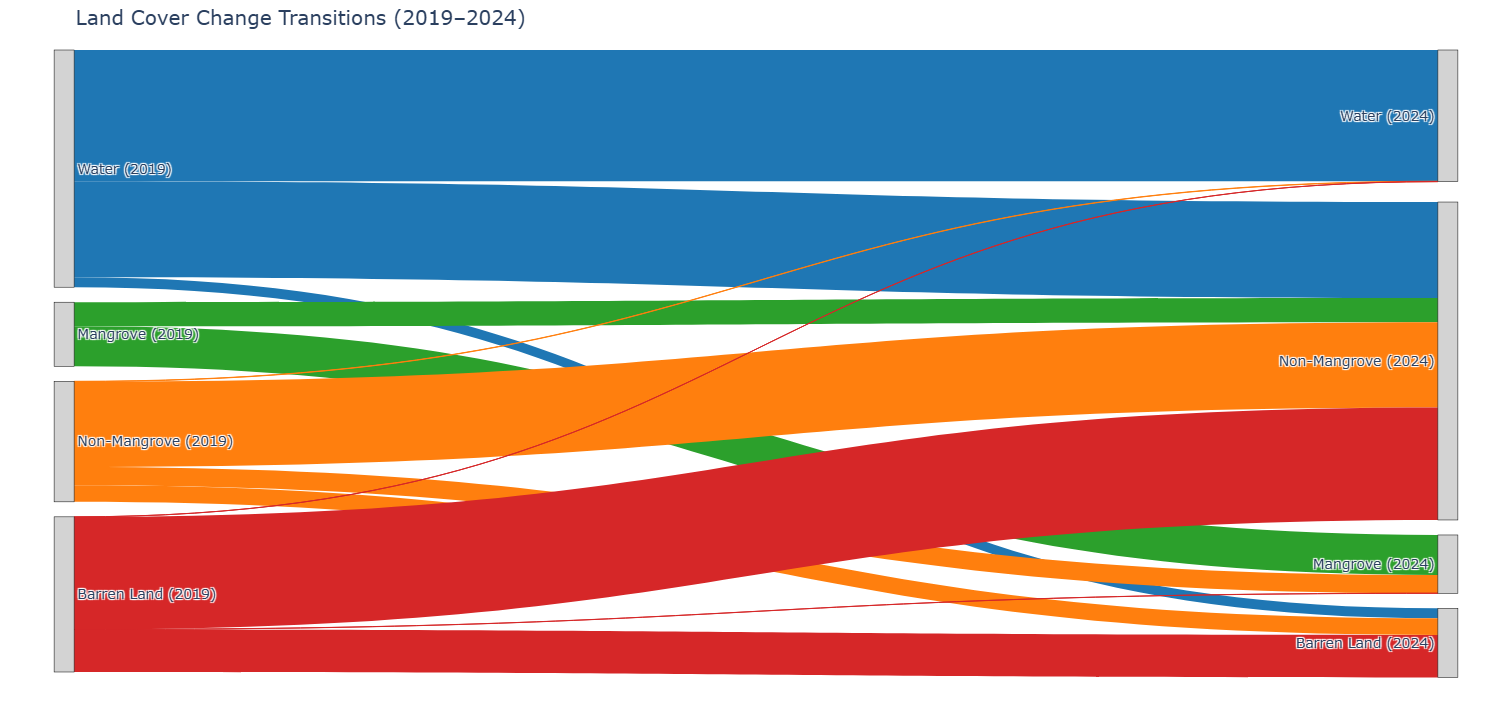
The classification results highlight clear differences between the SAR-only model and the fused SAR–optical model. The SAR-only classification captured the general distribution of mangroves but produced dense green patterns that often mixed mangroves with other vegetation types. The fused model provided a more detailed representation of land cover, with improved separation between mangroves, non-mangrove vegetation, water, and barren areas. The maps below show the spatial outputs from both models, along with zoomed-in examples that illustrate where data fusion offered a noticeable improvement.
Discussion & Conclusion
The comparison between the SAR-only and fused SAR–optical classifications shows how combining structural and spectral information improves the mapping of mangrove ecosystems in Ambanja Bay. The SAR-only model captured the general shape and extent of mangroves, especially in areas where vegetation structure is strong, but it often grouped mangroves with other dense vegetation. The fused model produced clearer class boundaries and reduced confusion between similar land cover types, which is consistent with the ability of optical indices to differentiate vegetation based on greenness and biomass. Although the fused approach provided better spatial detail, both models revealed similar broad patterns of mangrove distribution, suggesting that SAR remains a reliable alternative in regions where optical imagery is limited by cloud cover. Together, these results show that data fusion enhances land cover separability, while SAR alone still holds practical value for consistent monitoring in tropical environments.
This project demonstrated the value of integrating SAR and optical data for mapping mangrove ecosystems in Madagascar. The fused model delivered the highest classification clarity, while the SAR-only model performed reasonably well and showed potential for use in cloud-prone areas. The workflow developed here provides a scalable foundation for mangrove monitoring and can be applied to other coastal regions with similar environmental challenges. Overall, the study highlights how Earth observation data can support conservation efforts by improving our understanding of mangrove extent, condition, and change over time.